Introducing SID 1 –
Smart. Industrial. Diagnostics.
Pronetiqs has developed an easy-to-use diagnostic software that enables you to take preventive actions based on mathematical certainty; giving you unprecedented control over your downtime.
SID 1 being a self-contained software-only package; it avoids cloud connection.
Limitless scalability with NO data leaving your premises, compatible with almost every system; not bound to any processes, allowing for borderless deployment.
Pronetiqs introduces SID 1 (Smart. Industrial. Diagnostics.) – a standalone predictive maintenance software that calculates the mechanical health of your industrial machines. Using inverse PID technology on control loops, it provides early indications of wear & tear and mechanical faults based on a true mathematical algorithm. This gives machine owners time to put preventative measures in place, avoiding higher cost of production, costly downtime or even delayed shipment of products to customers.
The Software package.
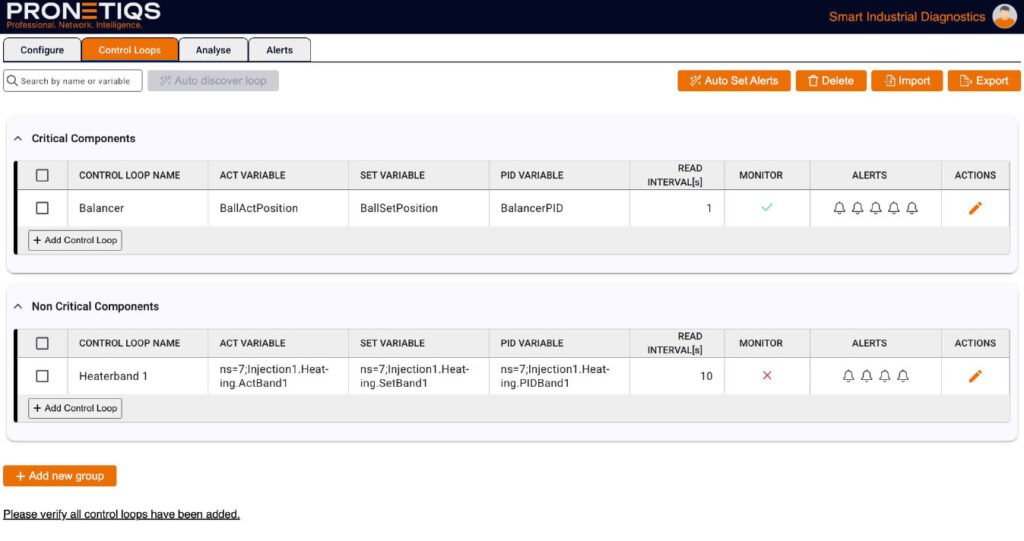
Whether you are a machine builder, own the machine, operate the machine inside a facility or maintain them for third parties, SID 1 will provide you with unparalleled insight into the degradation that occurs over time. By giving you the power to monitor at the control loop level, SID 1 will provide you with early insight into drops in efficiency, upcoming failures and higher costs of running your machine. This allows to schedule the time and opportunity to schedule maintenance, reducing unwanted downtime to an absolute minimum and making sure your ambitious targets are achieved.
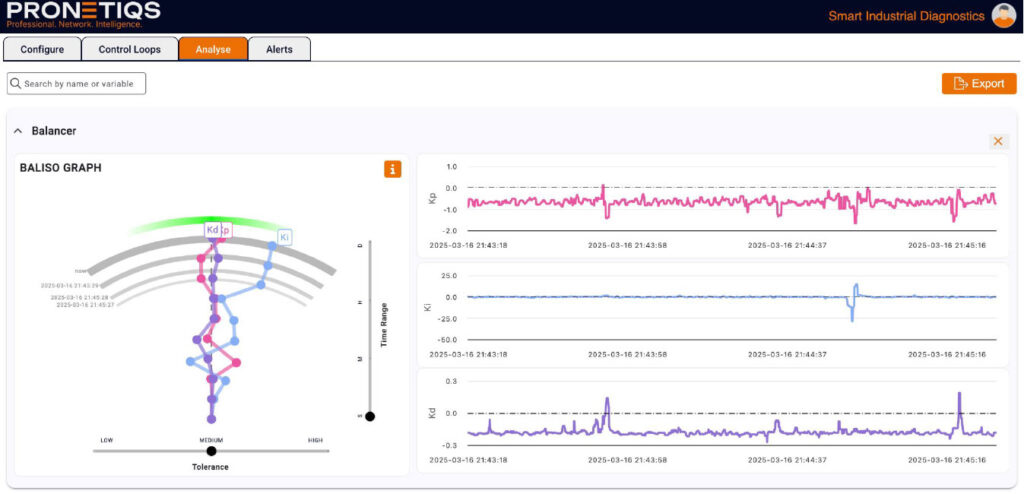
With our 50 plus years of experience in the industry we fully understand that processes differ and with that the tolerances in your system will vary depending on what you produce. To make sure you can focus on the results and not get distracted by too many alarms we have created The Baliso Graph, an easy and simple to use graph within our UI, through which you can decide the tolerance level that fits your process best. This gives you the confidence in knowing that you will be promptly notified of any deviation outside the norm.
Once SID 1 is installed you will also have the option to export your set Control Loops and import them into another SID solution, which allows seamless deployment across your other processes.
The Baliso Graph.
We have created the Baliso Graph to visualise any changes detected within the Control Loop in an intuitive and easy-to-understand way. The Baliso Graph (a combination of Balance and Iso, which is the Greek word for equal) displays live data points, separated into the Proportional, Integral and Derivative gains.
Your Data. Your privacy.
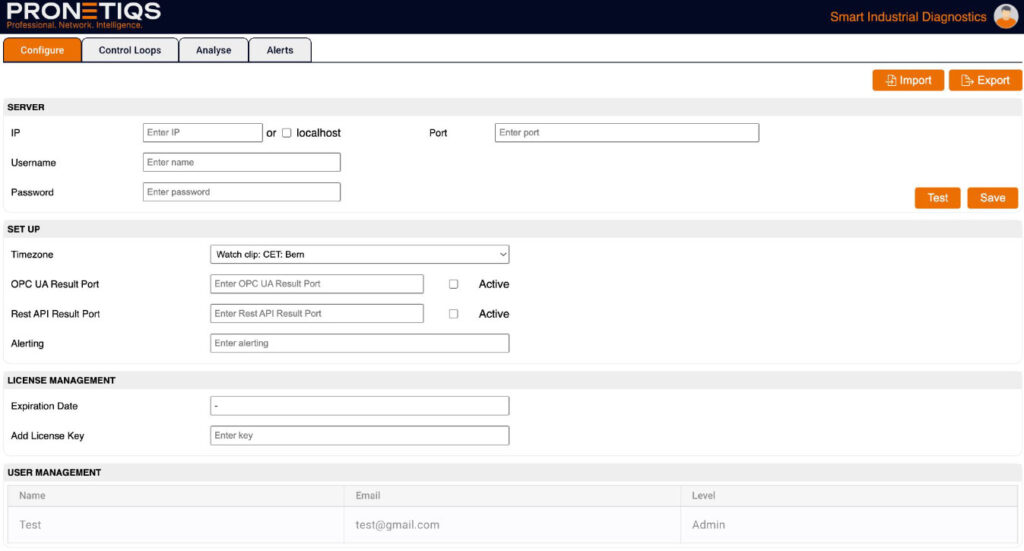
SID 1 collected data does not leave your premise! There is no cloud connection to the outside world, keeping your data safe. Calculated information is communicated via Restful API or HTTPS. Once installed, SID 1 will gather minimal production data from the process and use data points to create it’s predictive mathematical matrix. Once calculated it will start presenting you with its findings within minutes and will keep on doing so 24/7, 365 days a year: year after year.
You will be alerted.
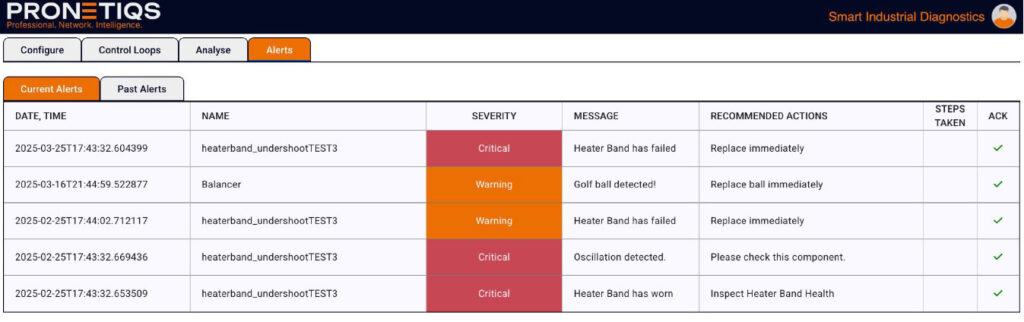
When your gains start to deviate outside of your toleranc,e SID 1 will immediately send you a warning. For each of the control loops added you will be alerted with a severity level of whether it is a “warning” or “critical” case, based on the settings that have been configured within the control loops section. Each alert with its timestamp can be acknowledged once the desired action has been completed. It will also show you the monetary value of the error, making sure that immediate action will be taken, to fix it!
This will allow you to keep your head cool even in the worst of circumstances, giving you the power to decide upon the best course of action for your processes.
That’s SID.
Want to learn more about SID 1 and how we can help you get home on time?
Send us a direct mail to info@pronetiqs.com or fill out the form, and we will get in touch with you!